
Search News
Industry Portal
Hot Articles
How much canopy can 600W LED grow lights cover effectively?
Time
Click Count
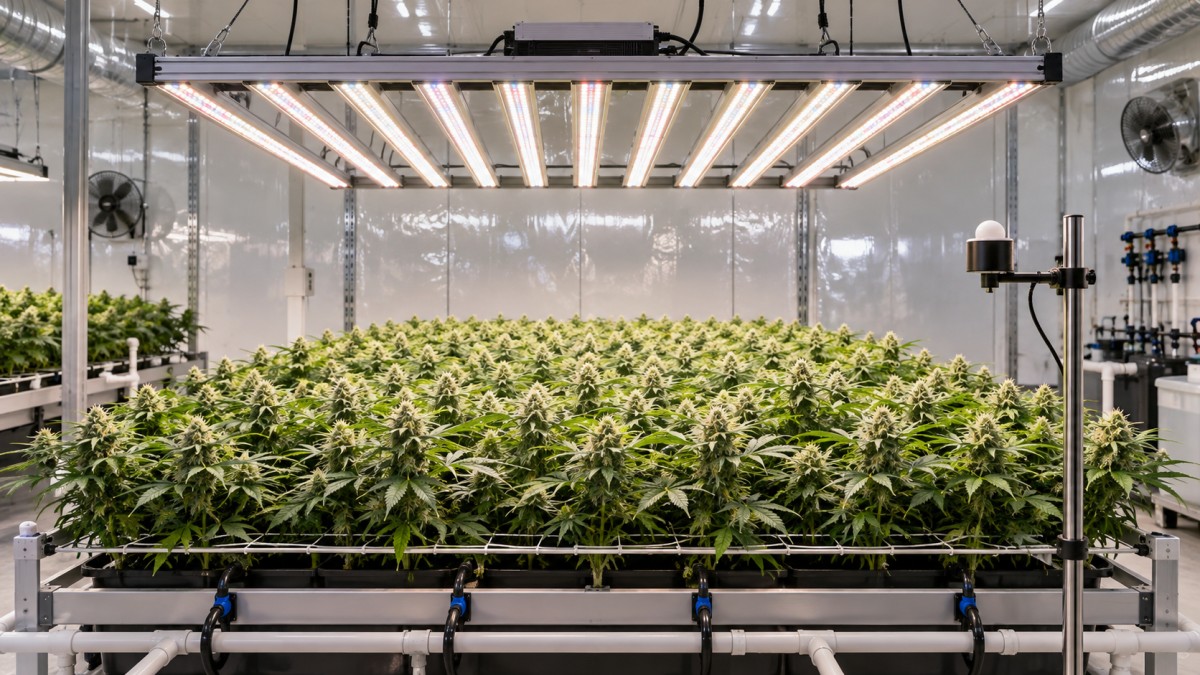
A modern 600W LED fixture can effectively cover about 4 ft x 4 ft of dense, high-light canopy for flowering crops when the fixture has strong photon efficacy, an even optical layout, and appropriate mounting height. The same unit can often cover 5 ft x 5 ft during vegetative growth, where the required photon density is lower. A claimed 6 ft x 6 ft footprint is usually a low-intensity coverage area rather than a full-production flowering area, unless several fixtures overlap or the crop has unusually modest light demand.
That distinction matters because electrical wattage describes input power, not the quantity or distribution of usable plant light. Two fixtures labeled 600W can produce materially different results if one converts electricity into photosynthetic photons more efficiently, concentrates output toward the center, or loses a large share of emitted light above the crop perimeter. Coverage must therefore be judged as a combination of photon output, PPFD distribution, canopy geometry, and the intended crop stage.
Start with the usable flowering footprint
For a single 600W LED grow light, a 4 ft x 4 ft canopy is the most defensible starting point for intensive flowering evaluation. This area equals 16 square feet, or roughly 1.49 square metres. It allows the fixture to deliver meaningful photon density across the crop rather than producing a bright central zone surrounded by weak edges.
A 5 ft x 5 ft footprint increases the area to 25 square feet. That is a substantial change: the same photon output is spread over more than one and a half times the original canopy area. At this size, average PPFD falls, edge uniformity becomes more important, and the light is better suited to vegetative development, propagation transition, or crops grown under a lower-light strategy.
Fixture output should be expressed in PPF, measured in micromoles per second, while canopy intensity is expressed as PPFD, measured in micromoles per square metre per second. PPF describes how many photosynthetic photons leave the fixture. PPFD describes how many arrive at a specific point on the canopy. The second figure determines whether the proposed coverage actually supports the crop.
For a rough initial calculation, divide fixture PPF by canopy area in square metres. This produces a theoretical average before losses from fixture geometry, room reflections, mounting height, and light falling outside the crop. A 600W unit with a high efficacy rating can produce enough photons for a productive 4 ft x 4 ft flowering area, but the calculation alone does not prove uniformity. The center-to-edge spread on the PPFD map remains the deciding evidence.
PPFD targets change the answer
The required coverage is tied to the crop's photosynthetic demand and to the daily light schedule. Vegetative plants generally tolerate and use lower PPFD than flowering plants carrying dense fruit or flowers. A fixture that appears oversized in a young vegetative room can become only adequate once the canopy is mature, flat, and operating under a long daily photoperiod.
Daily light integral, or DLI, links PPFD with lighting duration. A lower instantaneous PPFD can deliver an adequate daily photon dose when the lighting period is longer. Conversely, a short photoperiod demands higher PPFD to reach the same daily total. Coverage claims that omit photoperiod are incomplete because a 5 ft x 5 ft layout may be satisfactory under one schedule and underlit under another.
Increasing PPFD without controlling temperature, root-zone condition, irrigation, and nutrient supply can also create a misleading trial. Leaf curl, bleaching, stalled growth, or excessive transpiration near the fixture may be interpreted as a coverage failure when the real issue is that the crop environment cannot support the chosen light level. The fixture should be assessed within the intended environmental setpoint rather than in isolation.
Read the PPFD map as a distribution document
A PPFD map is more useful than a headline coverage number when it states the mounting height, measurement grid, dimming setting, and footprint dimensions. Without those details, the map cannot be compared to an actual installation.
The most revealing values are often not the highest central reading or even the stated average. Examine the corner readings, the midpoint readings along each edge, and the difference between the lowest and highest locations. A fixture can post a convincing average while concentrating excessive intensity beneath its center. The crop then develops unevenly: central plants receive more light than they can use comfortably while outer plants stretch toward the fixture and mature more slowly.
For a square 4 ft x 4 ft tent or bed, a map collected over a 4 ft x 4 ft measurement field is relevant. A map taken over a smaller field may hide spill light and exaggerate average intensity. A map over a larger field can be equally misleading if much of the measured space lies outside the intended crop footprint. The measurement area should match the actual planted area, not simply the room dimensions.
Bar-style fixtures with several separated LED rails tend to distribute light more broadly than a compact central panel at the same power. Their extended emitting area allows the fixture to be hung somewhat closer while reducing the extreme hotspot associated with a dense point-like source. A compact fixture can still perform well, but it often needs more mounting distance to blend the beams. Raising it broadens the footprint while reducing canopy PPFD, so the apparent coverage gain can come at the expense of flowering intensity.
Mounting height is part of the fixture selection
A stated coverage area has no meaning without hanging height. At a lower mounting position, light intensity rises sharply in the center and the usable footprint contracts. At a higher position, the field spreads and edge readings improve, but every point receives fewer photons. Reflective walls recover some sidelight, yet they do not correct a fundamentally narrow optical distribution.
The practical procedure is to begin at the manufacturer’s flowering mounting range, measure at canopy height, then adjust in small increments. Measurements should be taken after the fixture has warmed to steady operating condition and with the sensor held level. A handheld quantum sensor is preferable; phone applications and lux meters can provide only rough screening because their spectral response may not align with the fixture spectrum.
Canopy height must remain stable during the trial. Fast-growing crops can move several inches closer to the fixture between inspections, changing PPFD at the top leaves and creating a false impression that dimming or fixture replacement is required. Trellis height, container height, and expected stretch should be included before finalizing suspension hardware. Adjustable ratchet hangers or rigid mounting brackets need enough load rating and heat clearance for the fixture, driver, and cable routing.
Canopy shape can reduce effective area
The advertised footprint assumes a level horizontal plane. Most real crops are not perfectly level. Tall central branches, uneven benches, and plants placed in oversized containers create a three-dimensional canopy that receives uneven light even beneath a uniform fixture. The highest leaves may be overexposed while lower productive sites remain shaded.
A 4 ft x 4 ft light field does not automatically support sixteen square feet of productive biomass. The result depends on whether plants fill the corners, whether branches are trained outward, and whether leaf layers are dense enough to block lower sites. A shallow, even canopy uses the fixture’s distribution efficiently. A canopy with a high central peak effectively shrinks the usable area because the light must be raised to protect that peak.
Spacing between adjacent fixtures deserves the same attention. When multiple units are placed in a grid, leaving a gap based only on nominal 4 ft x 4 ft coverage can create dim lanes between fixtures. Conversely, excessive overlap wastes energy and can produce hot bands. The correct spacing comes from overlaying PPFD maps at the planned height and looking at the combined field, including the outside perimeter where no neighboring fixture contributes.
Electrical draw and thermal behavior should be verified
“600W” may refer to maximum driver capacity, a nominal product class, or actual wall draw at full output. Confirm the measured input power at the selected dimming level and supply voltage. A unit that draws materially less than its stated power can still be efficient, but its PPF and coverage expectation must be recalculated from its actual output rather than its label.
Driver placement also affects installation quality. A remotely mounted driver removes a heat source from the grow space and may simplify thermal management, but cable length, connector rating, strain relief, and access for servicing need review. An integrated driver reduces parts around the fixture but adds heat above the canopy. Neither arrangement changes photons directly; both can affect room temperature, fixture longevity, and how close the fixture can be mounted.
Dust accumulation on diodes, lenses, or protective covers gradually reduces output and can distort distribution where debris collects unevenly. Cleaning should follow the fixture documentation and occur with power disconnected. A production layout benefits from recording initial PPFD measurements so later readings can distinguish normal crop variation from light depreciation or a failing driver channel.
When a 600W unit is the wrong coverage tool
A single fixture becomes a poor fit when the required canopy is long and narrow, such as a 2 ft x 8 ft rack. Although the area equals a 4 ft x 4 ft square, the geometry does not. A broad square fixture leaves weak ends on a long bed, while two smaller fixtures or a linear bar arrangement can produce a more even field.
Very tall crops present another limitation. Light decreases with distance and lower leaves are shaded by upper foliage, so a single overhead 600W source may provide acceptable top-canopy PPFD while leaving lower production sites underlit. Supplemental interlighting, crop training, or a shorter canopy profile addresses that distribution problem more directly than simply increasing fixture wattage.
The workable decision is therefore straightforward: treat 4 ft x 4 ft as the primary flowering footprint for a capable 600W LED fixture, treat 5 ft x 5 ft as a vegetative or lower-intensity footprint, and validate the final layout with a PPFD grid at the actual hanging height. The result should be judged by the lowest useful canopy readings and their consistency across planted positions, not by the brightest number beneath the center of the light.
- Last One:No more articles
- Next Article:How to assess supplier capability before awarding a procurement contractOct 10, 2026
Recommended News