
Search News
Industry Portal
Hot Articles
How much do 600W LED grow lights cost to run for 12 hours a day?
Time
Click Count
A grow light that actually draws 600 watts uses 7.2 kilowatt-hours (kWh) in 12 hours. At an electricity rate of $0.15 per kWh, that costs $1.08 per day, $32.40 over 30 days, or $394.20 over 365 days. These figures cover the light itself; ventilation, cooling, and other equipment add to the electricity bill.
The biggest purchasing trap is the meaning of “600W.” A fixture advertised as a “600W equivalent” does not necessarily consume 600 watts. Before comparing running costs, establish its actual input power, then apply your electricity rate and intended schedule.
The running cost at different electricity rates
The calculation is straightforward:
Daily electricity cost = input watts ÷ 1,000 × operating hours × price per kWh.
For a true 600W fixture operating for 12 hours, the energy calculation is 600 ÷ 1,000 × 12 = 7.2 kWh. Over a 30-day month, consumption reaches 216 kWh. The table below uses illustrative electricity rates, all expressed in US dollars; they are calculation examples, not estimates of local tariffs.
Annual figures assume the same 12-hour schedule every day. For a shorter growing period, multiply the daily cost by the actual number of operating days. A 90-day run at $0.15/kWh, for example, costs $97.20 for the fixture.
Multiple lights scale directly: two fixtures drawing 600W each consume 14.4 kWh per 12-hour day. Their combined lighting cost at $0.15/kWh is $64.80 over 30 days, before supporting equipment.
Establish what “600W” means before comparing prices
Product listings sometimes place actual power consumption, replacement wattage, and model names close together. Only the electrical input power at the intended operating setting belongs in your running-cost calculation.
Look for a specification labeled “input power,” “power draw,” or “wall power.” A headline claiming “600W equivalent” describes a comparison with another lighting product, which might not be defined clearly. Likewise, adding together the maximum ratings of individual LED chips does not establish how much electricity the assembled fixture consumes.
Suppose a listing uses “600W” in its name but specifies 120W input power. At 12 hours per day and $0.15/kWh, its calculated running cost is $6.48 over 30 days. That lower bill does not establish equivalent growing performance. The fixture could deliver substantially less light or cover a smaller growing area.
For a fixture with a separate LED driver, confirm that the stated input includes driver losses. A specification for power delivered to the LED boards alone understates the electricity taken from the outlet. Full-fixture wall power is the useful number for budgeting.
A suitably rated plug-in energy meter provides a practical verification method. Measure the complete fixture at the brightness setting you intend to use, allow it to stabilize, and record energy over a full lighting cycle when possible. A kWh reading captures changes during operation more directly than a single wattage snapshot.
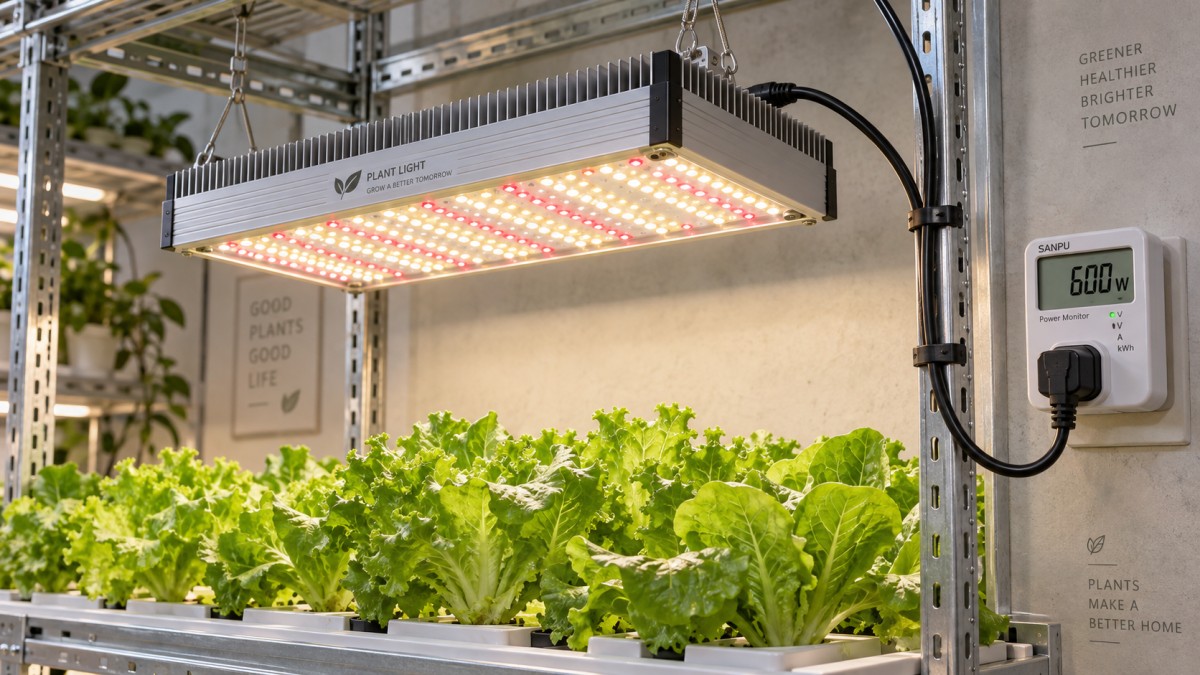
Match the meter to the supply voltage and the equipment’s electrical ratings. For hardwired equipment, use appropriate installed metering or qualified electrical assistance rather than adapting a plug-in meter.
Use the electricity price that applies to added consumption
Your bill’s headline energy rate might exclude delivery charges or other charges assessed per kWh. For a useful estimate, include the variable charges that increase when the light consumes additional electricity.
A fixed monthly account charge usually stays the same whether the fixture runs or not. Dividing the entire bill by total household consumption blends that fixed charge into an average rate, which can distort the cost of adding a grow light.
Tiered tariffs require particular care. If the extra 216 kWh pushes household consumption into a more expensive tier, apply the relevant prices to each portion of the added usage. Pricing everything at the lowest tier understates the resulting bill.
When the 12-hour window crosses different rates
With time-of-use pricing, calculate consumption separately for each rate period. For example, assume eight hours at $0.10/kWh and four hours at $0.30/kWh:
- The eight lower-rate hours use 4.8 kWh and cost $0.48.
- Four higher-rate hours add 2.4 kWh, costing $0.72.
The total is $1.20 per day, or $36.00 over 30 days. Moving the entire 12-hour period into a $0.10/kWh window would reduce the lighting cost to $21.60 for that month, provided such a window exists and fits the growing conditions.
Changing the schedule also changes when heat and humidity enter the room. An overnight lighting period could reduce overlap with hot daytime conditions, but the plant’s required light and dark cycle must remain consistent.
The room adds costs beyond the fixture
A 600W light produces a substantial heat load in an enclosed growing space. Energy entering as light is largely converted to heat after absorption within the space, while the driver also releases heat. Positioning the driver outside a tent moves some heat outside that enclosure, although it remains inside the building if installed in the same room.
Ventilation and mechanical cooling have different electrical consequences. An exhaust fan moves air; an air conditioner actively transfers heat. Their power consumption should be measured or estimated separately instead of assigning an arbitrary percentage to the lighting bill.
Consider a hypothetical setup with a 600W fixture running 12 hours daily, a 40W exhaust fan running continuously, and a 20W circulation fan also running continuously:
This example excludes air conditioning, dehumidification, pumps, and heating. Add each device using its actual operating time. A dehumidifier’s rated input multiplied by 24 hours overstates consumption if its compressor cycles off for much of the day; measuring accumulated kWh gives a stronger basis for budgeting.
Humidity control can remain necessary during darkness because plants and growing media continue releasing moisture. Assuming every accessory follows the light’s timer can therefore leave a noticeable gap in the estimate.
Lower wattage saves money only if the lighting still fits
Dimming reduces consumption, but the control position is not a guaranteed measurement of wall power. A dial set halfway does not prove the fixture draws exactly 300W. Driver behavior, control calibration, and minimum operating power affect the relationship.
If measurement shows 420W at your chosen setting, 12 hours of operation uses 5.04 kWh daily. At $0.15/kWh, that costs approximately $22.68 over 30 days, saving $9.72 compared with a constant 600W draw.
That saving is useful only if the plants still receive the required light across the growing area. Compare fixtures using a canopy light-distribution map at a stated hanging height and coverage area. A bright center reading can conceal weak edges, leading to a purchase that needs supplementary lighting.
Photosynthetic photon flux density, or PPFD, describes the useful light reaching a given area at a moment in time. Daily light integral, or DLI, accounts for how much arrives across the day. At a constant canopy PPFD, the relationship is:
DLI = PPFD × lighting hours × 0.0036.
For illustration, 500 micromoles per square meter per second over 12 hours produces a DLI of 21.6 moles per square meter per day. This is an arithmetic example, not a recommended target for every plant. Suitable intensity and duration depend on the crop and growth stage.
Reducing operating hours simply to cut the bill changes both daily light delivery and the dark period. Some plants respond strongly to day length. If a 12-hour schedule serves a specific flowering requirement, extending the day to compensate for a weaker fixture could disrupt that requirement.
Turn the electricity estimate into a purchase comparison
Compare purchase price and operating cost at an equivalent growing task: the same canopy area, suitable light distribution, and required schedule. Wattage alone cannot establish value, because two fixtures consuming 600W can deliver different amounts of useful light to the plants.
Fixture efficacy, expressed in micromoles per joule, helps assess light output relative to electrical input. Confirm that the figure describes the complete fixture, including its driver, rather than an individual LED component. Then relate it to the distribution map; high total output does not guarantee even coverage.
A simple payback calculation can clarify whether a higher purchase price is justified. Suppose two suitable fixtures provide comparable canopy lighting, but one draws 600W and the other 500W. The 100W difference saves 1.2 kWh per 12-hour day. At $0.15/kWh, that equals $5.40 over 30 days.
If the lower-consumption option costs an additional $150, recovering that premium through lighting electricity alone takes about 27.8 operating months of 30 days each. Seasonal use stretches the calendar payback. Reduced cooling demand could shorten it, but include that benefit only when supported by a separate estimate or measurement.
Before ordering, obtain the full-fixture input power, the light-distribution data for your intended area, and the delivered purchase price. Those figures let you distinguish a genuinely lower operating cost from a smaller light with a similar marketing label.
After installation, record one complete day of fixture consumption and, separately, the supporting equipment’s energy use. Multiplying those readings by the applicable tariff gives a budget grounded in the actual setup—and reveals whether any unexpected expense comes from the light, its schedule, or the room’s environmental controls.
- Last One:No more articles
- Next Article:Why does sensor-based lighting in smart buildings switch off too soon?Oct 16, 2026
Recommended News